DevLens: Catch Every Silent Failure in Your JavaScript App
The 30-Minute Debugging Session That Shouldn’t Exist
You’ve been here. Your app renders a blank page. You open the console — nothing. No red text, no stack trace, no clue. So you start the ritual: add console.log before the fetch call. Refresh. Add another one after the response. Refresh. Sprinkle a few more inside the component. Refresh, refresh, refresh.
Twenty minutes later, you find it. The API returned a 500, but your code didn’t check the status. The response body was empty. user.profile.settings is undefined. The component tried to render settings.theme and got… nothing. No crash. No error. Just a blank white screen staring back at you.
This isn’t a rare edge case. This is Tuesday.
The root of the problem is that JavaScript is designed to fail silently. Accessing a property on undefined returns undefined — it doesn’t throw. A fetch call that gets a 500 response doesn’t reject the promise. Your component receives null from a hook and renders nothing. The language actively helps your bugs hide.
What If Your App Could Tell You?
That’s the idea behind DevLens. It’s an open-source SDK that watches your running JavaScript app and automatically detects the silent failures that waste your time — API errors, null access, missing render data, unhandled rejections — then logs them with enough context to fix the issue immediately.
DevLens is a development-time tool. It runs in your browser while you’re coding. It’s not Sentry. It’s not Datadog. Those are production monitoring tools that tell you what happened after users hit the bug. DevLens tells you while you’re looking at the screen, before you even notice something is wrong.
Think of it as ESLint for runtime errors — but instead of scanning your source code, it watches your running app.
Zero config. Dev-only. Drop it in and see everything.
What It Catches
Network Failures
DevLens automatically intercepts every fetch and XMLHttpRequest call in your app. When an API returns a 4xx or 5xx status, you see this in your console:
[NET] DevLens [ERROR] network: POST /api/users returned 500 Internal Server Error
  |- Status: 500
  |- Duration: 1234ms
  |- Suggestion: Server returned 500 - check server logs
  \- Source: NetworkInterceptor
No manual try/catch. No response status checking. You just see it.
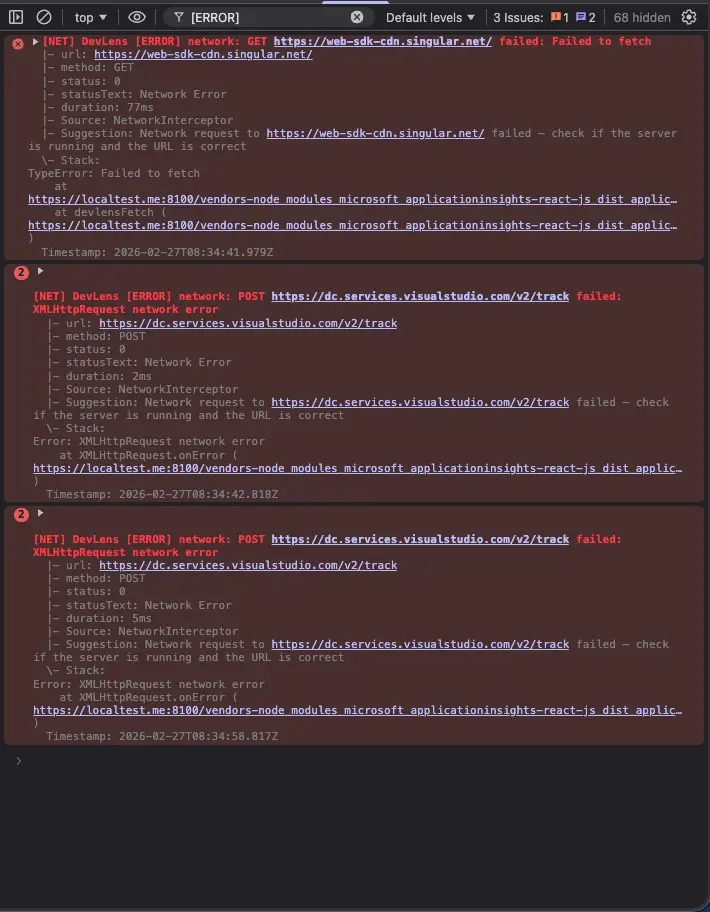
Structured console output with severity levels, property paths, and actionable suggestions
Null and Undefined Access
This is the big one. DevLens wraps your data objects in an ES6 Proxy that tracks every property access. When you hit null or undefined, it tells you the exact path:
import { useGuardedState } from '@devlens/react';

function UserProfile() {
  const [user, setUser] = useGuardedState(initialUser, 'UserProfile');

  // If user.profile.avatar is null, DevLens logs:
  // [NULL] DevLens [WARN] null-access: Property "avatar" is null
  //   at path "user.profile.avatar"
  return <img src={user.profile.avatar} />;
}
Instead of a blank <img> tag and a confused developer, you get the property name, the full path, the actual value found, and a suggestion. Before it cascades into a visible bug.
Missing Render Data
Sometimes the data isn’t null on a deeply nested path — it’s null at the top level. A hook returns undefined. A prop is missing. DevLens watches for that too:
import { useGuardedEffect } from '@devlens/react';

function Dashboard({ user, posts, settings }) {
  useGuardedEffect({ user, posts, settings }, 'Dashboard');

  // If posts is undefined:
  // [RENDER] DevLens [WARN] render-data: "posts" is undefined in Dashboard
  return <div>...</div>;
}
One line. All your critical data values monitored.
Unhandled Errors
Global window.onerror and unhandled promise rejections are caught and logged with full stack traces and suggestions. You stop missing the errors that fire once during initial load and scroll off the top of your console.
Error Boundary (React)
DevLens includes an enhanced React Error Boundary that integrates with the detection engine:
<DevLensErrorBoundary
  fallback={(error, reset) => (
    <div>
      <p>Error: {error.message}</p>
      <button onClick={reset}>Retry</button>
    </div>
  )}
  onError={(error) => trackError(error)}
>
  <RiskyComponent />
</DevLensErrorBoundary>
When a component tree crashes, the error is captured by DevLens with context — not just the error message, but what the component was rendering and what data it had.
Under the Hood
A few technical details for the curious.
Network Interceptor works by monkey-patching window.fetch and XMLHttpRequest.prototype.open/send. It records the URL, method, status, response time, and body. When you call uninstall(), the original implementations are restored cleanly. It never touches your request or response data — it only observes.
Data Guardian uses ES6 Proxy with recursive wrapping. When you call guardian.guard(obj, 'label'), it returns a Proxy that intercepts get operations. Each nested access extends the tracked path — so accessing user.profile.avatar builds the path "user" -> "user.profile" -> "user.profile.avatar". When the value at any step is null or undefined, DevLens reports it with the full path. A maxDepth setting (default: 5) prevents infinite recursion on circular references.
The UI Panel is rendered inside a Shadow DOM container. This means its CSS — all 900+ lines of it — is completely isolated from your app. Your Tailwind classes won’t break the panel. The panel’s styles won’t leak into your layout. It sits at z-index: 2147483647 so it always floats above everything.
Production Safety is built in at every level. When NODE_ENV === 'production', the engine returns no-op implementations. The DevLensProvider renders its children directly with zero overhead. sideEffects: false in every package.json ensures your bundler tree-shakes the entire library out of production builds. No data is ever sent anywhere — everything stays in your browser.
Quick Start
React
npm install @devlens/core @devlens/reactimport { DevLensProvider, DevLensErrorBoundary } from '@devlens/react';
function App() {
return (
<DevLensProvider>
<DevLensErrorBoundary>
<YourApp />
</DevLensErrorBoundary>
</DevLensProvider>
);
}That’s it. Open your browser console.
Vue 3
npm install @devlens/core @devlens/vueimport { createApp } from 'vue';
import { createDevLensPlugin } from '@devlens/vue';
const app = createApp(App);
app.use(createDevLensPlugin());
app.mount('#app');Vanilla JS
npm install @devlens/coreimport {
createDetectionEngine,
createNetworkInterceptor,
createGlobalCatcher,
createDataGuardian,
} from '@devlens/core';
const engine = createDetectionEngine();
const network = createNetworkInterceptor(engine);
network.install();
const catcher = createGlobalCatcher(engine);
catcher.install();
const guardian = createDataGuardian(engine);
const data = guardian.guard(apiResponse, 'apiResponse');
// Accessing null/undefined properties now auto-logs
console.log(data.user.profile.avatar);Works with React, Vue, Svelte, vanilla JS, or anything that runs in a browser.
The Visual Tools
Console logging is the starting point, but DevLens goes further.
Floating Debug Panel
Add @devlens/ui and you get a floating panel overlay in your browser — toggle it with Ctrl+Shift+D.
import { createDetectionEngine } from '@devlens/core';
import { createDevLensPanel, createPanelReporter } from '@devlens/ui';

const panel = createDevLensPanel({ theme: 'dark' });
const engine = createDetectionEngine({
  reporter: createPanelReporter(panel),
});
The panel gives you:
- Issue list with severity bars (red/amber/blue) and category badges
- Timeline view showing issues chronologically
- Severity and category filtering — show only errors, or only network issues
- Full-text search across all issue messages, paths, and sources
- Session persistence — issues survive page reloads
- JSON/CSV export — download your issue log for sharing or analysis
All rendered inside Shadow DOM. Your app’s styles can’t break it. Its styles can’t break your app.
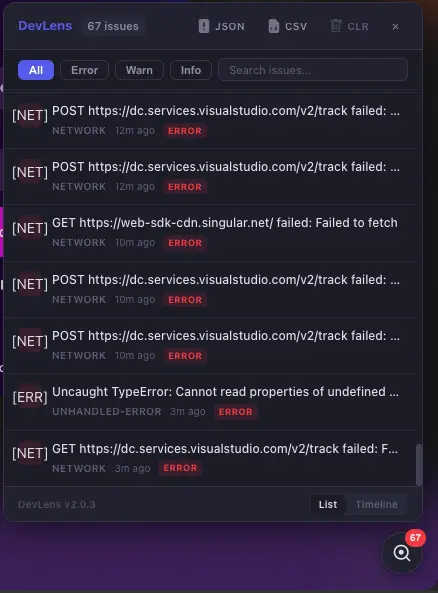
The floating debug panel overlay — always accessible via Ctrl+Shift+D, never interferes with your app.
Dashboard
For deeper investigation, DevLens includes a full dashboard that opens in a separate browser window.
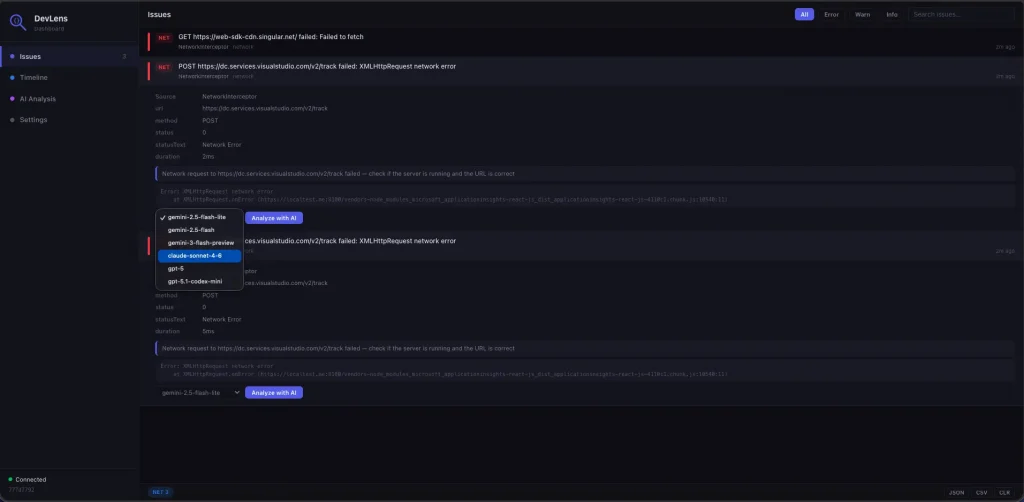
The DevLens Dashboard showing detected issues with severity indicators, category badges, and expandable detail rows.
It features four tabs:
Issues — A detailed list of every detected issue. Click any row to expand and see the property path, actual value found, source component, suggestion, and stack trace. Each issue has an inline “Analyze with AI” button.
Timeline — Chronological view with severity-colored dots on a vertical timeline. Good for understanding the sequence of failures.
AI Analysis — Select a model (Gemini, Claude, or GPT) and analyze all your detected issues at once. The AI identifies root causes, detects patterns across multiple issues, and suggests specific code fixes.
Settings — Session configuration, connection status, and export options.
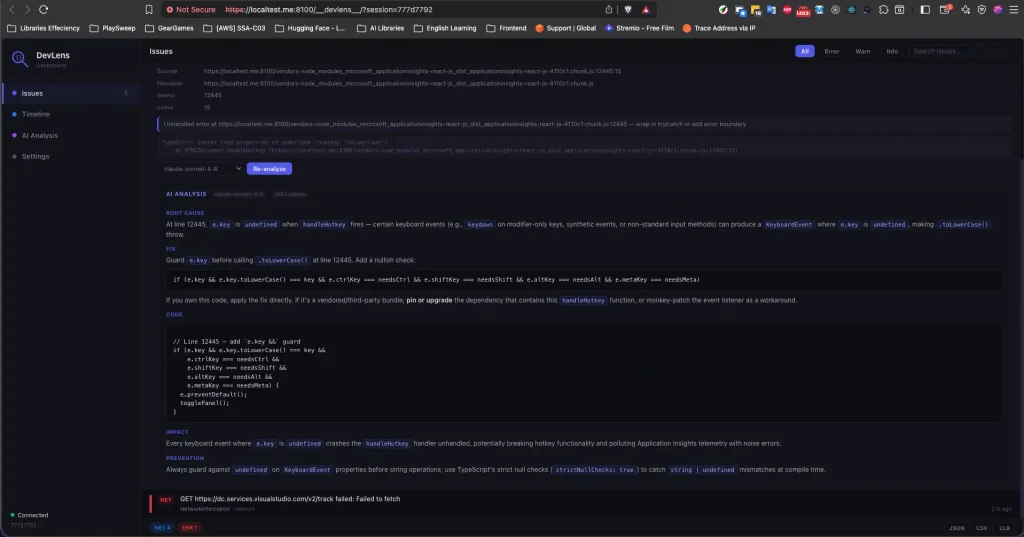
AI-powered analysis identifies root causes, detects patterns, and suggests fixes.
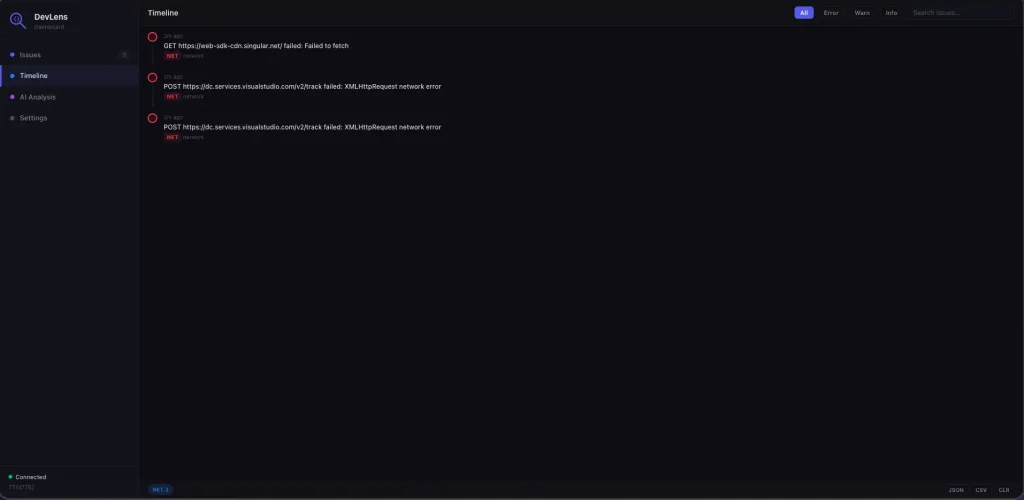
Timeline view showing issues chronologically with severity-colored dots.
Vite Plugin
If you’re using Vite, you can embed the dashboard directly into your dev server:
npm install @devlens/vite// vite.config.ts
import devlens from '@devlens/vite';
export default {
plugins: [devlens()],
};The dashboard is now available at http://localhost:5173/__devlens__/. No extra terminal window. No extra command. It’s served by the same dev server you’re already running.
What’s Next
DevLens is currently at v2.1. Here’s what’s shipped and what’s coming:
| Version | What | Status |
|---|---|---|
| v1.0 | Console logging — network, null detection, error boundaries | Shipped |
| v2.0 | UI panel overlay, Vue 3 support | Shipped |
| v2.1 | Inspector window, embedded dashboard via Vite plugin | Current |
| v3.0 | Deep AI integration — real-time pattern detection, auto-fix generation, CI/CD integration | In planning |
The v3.0 release will analyze patterns across your detected issues over time, identify recurring root causes, and generate code fixes — directly in your dev console or dashboard. Think of it as a debugging co-pilot that learns your app’s failure patterns.
The Numbers
- ~20KB core engine, ~5KB per framework adapter
- Zero runtime dependencies in
@devlens/core - Dual ESM + CJS output with full TypeScript declarations
- Supports React 17+, Vue 3.3+, and vanilla JS
- MIT licensed. Fully open source.
Try It
npm install @devlens/core @devlens/reactFive lines of code. Every silent failure in your app, caught and explained.
If DevLens saves you one 30-minute debugging session, it’s already paid for itself. And it will save you a lot more than one.


